This page is were I put news of my favorite teams, Mets and A's.
STANDINGS
Team
W
L
PCT.
GB
Atlanta
88
53
.624
-
Philadelphia
77
64
.546
11.0
Florida
76
65
.539
12.0
Montreal
72
70
.507
16.5
New York
62
78
.443
25.5
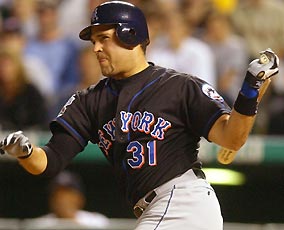
Mike Piazza
This is Mike Piazza hitting one of his many home runs. The greatest hitting catcher ever to play.
Shea Stadium
This is the ballpark where the New York Mets play. They will be getting a new ballpark soon
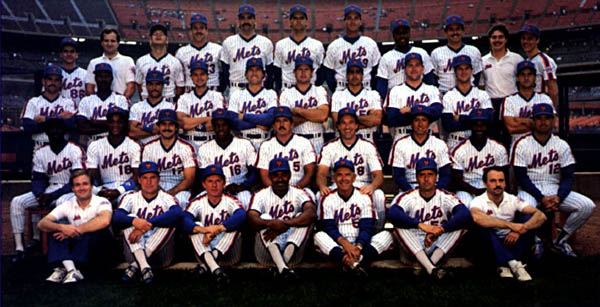
1986 Mets Team
In 1986 the New York Mets were world champs!
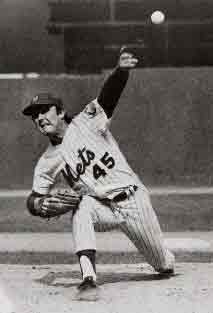
Tug McGraw
A picture for the Mets in 1973. One of the worst teams in baseball came back to win the pennant.
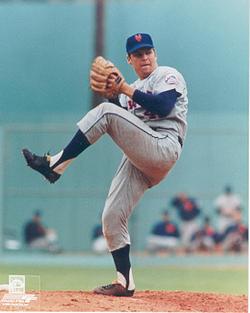
Tom Seaver
Only Hall of Farmer to go in as a Met. Great pitcher and is now an announcer for the Mets.
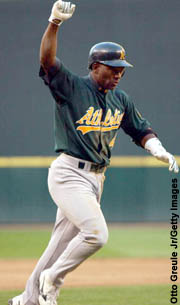
Miguel Tejada
Miguel Tejada hitting a walk-off home run
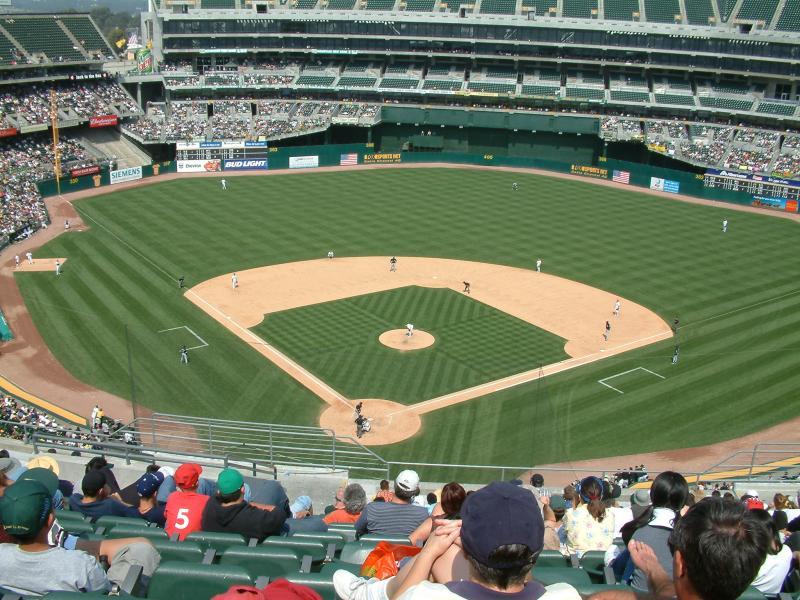
A's Stadium
A's Stadium is also home the Oakland's football team
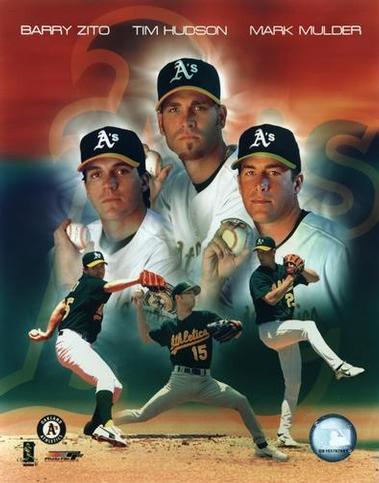
Zito, Hudson, Mulder
The best 3 pitchers on the same team in the MLB.
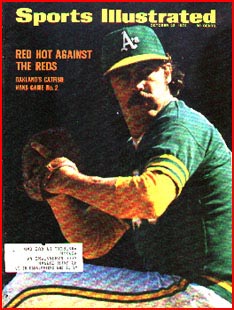
James Augustus "Catfish" Hunter
He received the Cy Young Award for best pitcher in his league in 1974 and was elected to the Basebal
Gus Zernial
Great slugger for the A's in 1954
STANDINGS
Team
W
L
PCT.
GB
Oakland
84
57
.596
-
Seattle
82
59
.582
2.0
Anaheim
67
73
.479
16.5
Texas
64
77
.454
20.0
Wild Card Standings
American League
Team
W
L
PCT
GB
E#
HOME
ROAD
EAST
CENT
WEST
NL
L10
STRK
Boston
82
58
.586
-
-
46-24
36-34
31-29
21-9
19-13
11-7
7-3
W4
Seattle
82
59
.582
0.5
22
43-29
39-30
18-21
32-13
22-17
10-8
6-4
W1
Chicago
74
66
.529
8.0
15
44-25
30-41
17-13
34-26
13-19
10-8
5-5
W1
Minnesota
74
66
.529
8.0
15
38-33
36-33
17-15
29-27
18-16
10-8
7-3
W3
Kansas City
72
67
.518
9.5
14
37-33
35-34
12-20
36-20
15-18
9-9
5-5
W1
Toronto
70
70
.500
12.0
11
32-37
38-33
28-34
15-13
17-15
10-8
6-4
W1
Anaheim
67
73
.479
15.0
8
38-32
29-41
15-30
24-14
17-22
11-7
4-6
L3
Texas
64
77
.454
18.5
4
38-33
26-44
22-23
21-18
17-22
4-14
3-7
L2
Baltimore
63
77
.450
19.0
4
35-34
28-43
25-31
14-18
19-15
5-13
2-8
L1
Cleveland
62
80
.437
21.0
1
35-36
27-44
12-14
31-31
13-23
6-12
4-6
L4
Tampa Bay
55
84
.396
26.5
E
31-39
24-45
28-27
12-20
12-22
3-15
4-6
L1
Detroit
37
103
.264
45.0
E
19-51
18-52
9-19
18-44
6-26
4-14
4-6
L1
National League
Team
W
L
PCT
GB
E#
HOME
ROAD
EAST
CENT
WEST
AL
L10
STRK
Philadelphia
77
64
.546
-
-
43-27
34-37
32-29
19-14
18-14
8-7
7-3
W4
Florida
76
65
.539
1.0
21
46-26
30-39
33-22
19-20
15-17
9-6
6-4
L1
Chicago
74
67
.525
3.0
19
37-35
37-32
11-13
37-32
17-13
9-9
6-4
W3
Los Angeles
73
66
.525
3.0
20
41-31
32-35
16-16
23-13
23-30
11-7
6-4
W1
St. Louis
73
69
.514
4.5
17
40-29
33-40
17-13
37-33
9-15
10-8
4-6
L3
Arizona
72
69
.511
5.0
17
40-31
32-38
16-16
20-13
25-36
11-4
3-7
W2
Montreal
72
70
.507
5.5
16
47-23
25-47
28-34
16-14
19-13
9-9
4-6
W1
Pittsburgh
64
75
.460
12.0
11
32-38
32-37
12-13
31-38
16-17
5-7
5-5
W1
Colorado
65
77
.458
12.5
9
45-25
20-52
11-21
16-17
29-33
9-6
1-9
L6
Milwaukee
62
78
.443
14.5
8
29-41
33-37
14-22
33-35
10-14
5-7
7-3
L1
New York
62
78
.443
14.5
8
32-38
30-40
25-36
15-18
17-14
5-10
4-6
L2
Cincinnati
61
79
.436
15.5
7
31-40
30-39
11-16
29-39
14-19
7-5
3-7
W1
San Diego
57
83
.407
19.5
3
30-39
27-44
10-22
12-22
27-29
8-10
6-4
L1
NOTE: E# indicates the Elimination Number, which is the combined number of wins (by the first place team) and losses (by the trailing team) that will eliminate the trailing team from winning the division. The Elimination Number for a particular team is determined by adding their number of losses to the number of wins for the team leading the division, and subtracting that total from 163. The Elimination Number for the second place team is the "Magic Number" for the first place team. "E" indicates that the team has been eliminated from winning the division.
Coming soon, more Mets and A's pictures and Standings update, Last updated 9/6/03